Workflow Performance
Reading time: 4 minutes
Introducing Formengine - The New Formbuilder, try for FREE formengine.io.


Reading time: 4 minutes
We’ve tested the performance of Workflow Engine and are happy to share the results with you. The tests were conducted on Windows and Linux. The standard version without further optimizations was tested.
Here we go…
We’ve measured the performance with SoapUI, a free automated testing tool, using the Simple strategy (SoapUI strategies) with different amount of threads: 1, 4, 8, and 16 threads. The control performance measurement was done over a set of 10 000 processes.
A scheme comprising three Activities and two Transitions is used in the test:

A single test consists of 14 steps executed successively. Each step in the test is a call of one of the basic API methods. You can read full description for Workflow Engine here, and for Workflow Server here.
| # | Step title | Description |
|---|---|---|
| Step 1 | createinstance | Creating of an instance |
| Step 2 | isexistprocess | Checking whether a process exists |
| Step 3 | getinstanceinfo1 | Getting a process instance with all parameters |
| Step 4 | getcommands1 | Getting a list of available commands |
| Step 5 | executecommand1 | Executing a command |
| Step 6 | getinstanceinfo2 | Getting a process instance with all parameters |
| Step 7 | getcommands2 | Getting a list of available commands |
| Step 8 | executecommand2 | Executing a command |
| Step 9 | getinstanceinfo3 | Getting a process instance with all parameters |
| Step 10 | getstates | Getting a list of available states |
| Step 11 | setstate1 | Setting process state |
| Step 12 | getinstanceinfo4 | Getting a process instance with all parameters |
| Step 13 | setstate3 | Setting process state |
| Step 14 | getinstanceinfo5 | Getting a process instance with all parameters |
We used a dedicated server with the following configuration for the test:
Workflow Server, the database and the testing tool were deployed to a single server in this test. 500 000 processes were created in the database before running the control test.
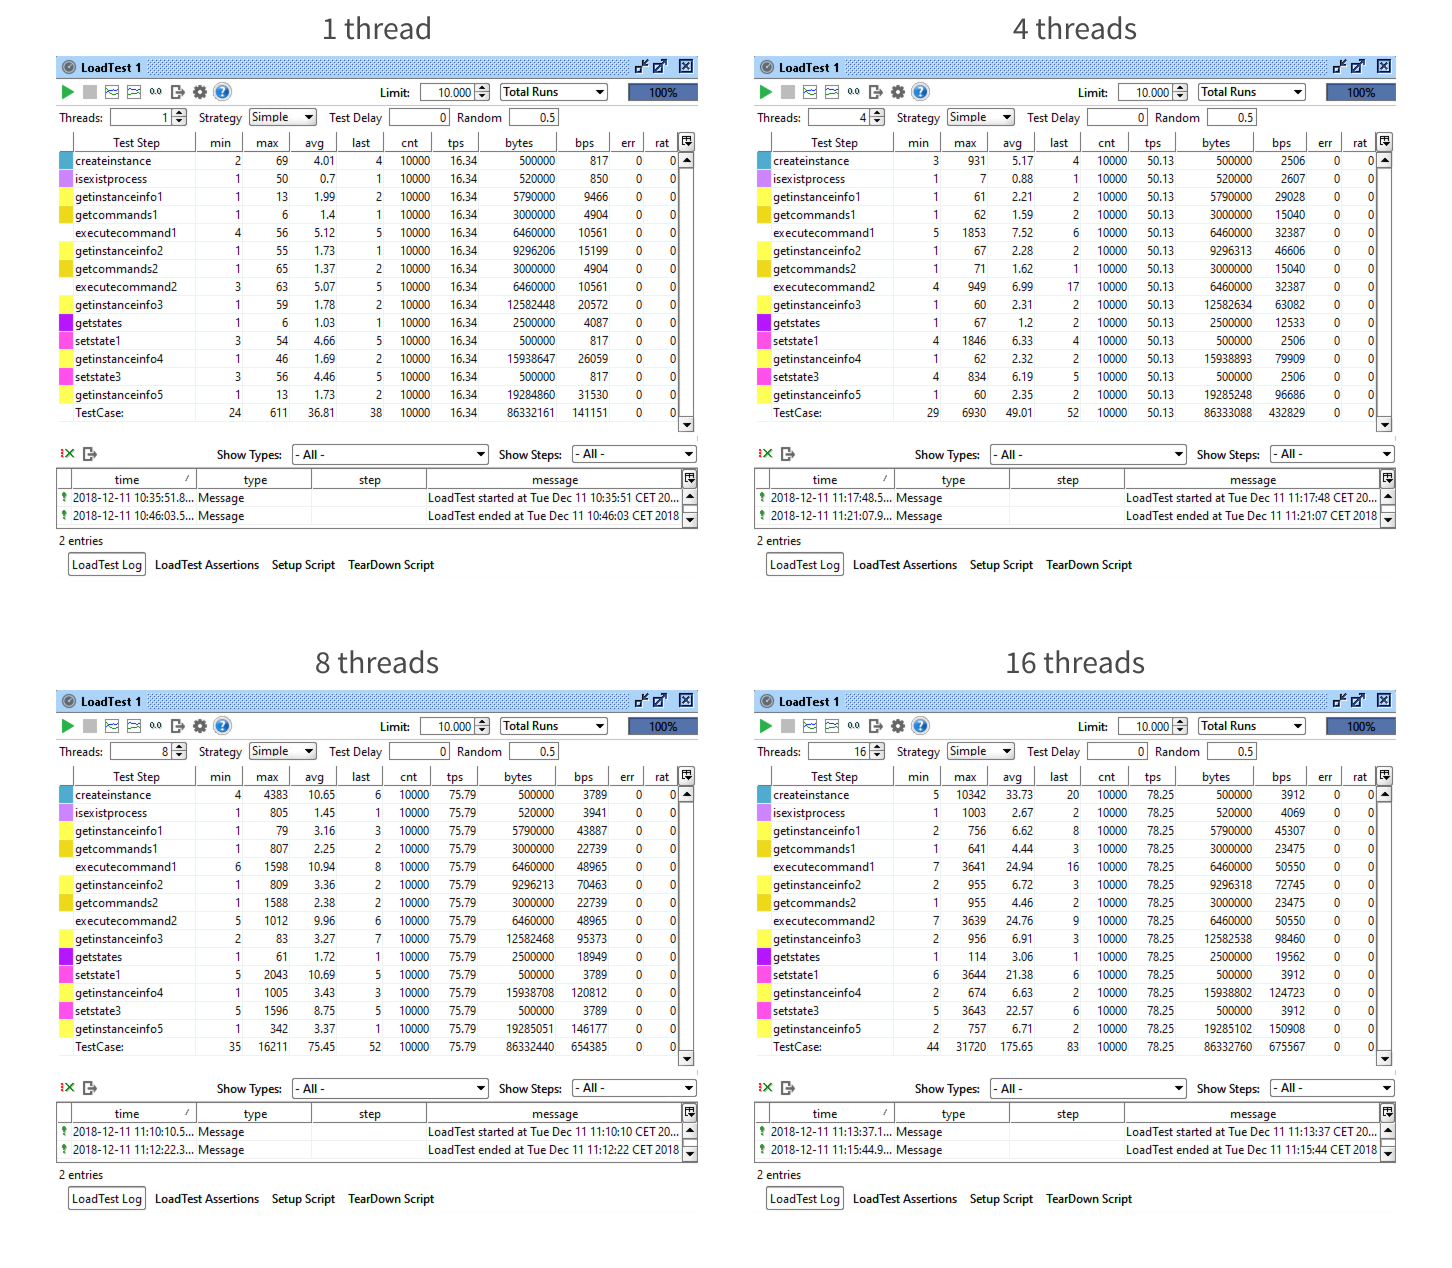
| Test | Total Time | Avg test time (ms) | Tests per second | Operations per second |
|---|---|---|---|---|
| 1 thread | 10:12 | 38.81 | 16.34 | 228 |
| 4 threads | 3:19 | 49.01 | 50.13 | 701 |
| 8 threads | 2:12 | 75.45 | 75.79 | 1 061 |
| 16 threads | 2:07 | 175.65 | 78.25 | 1 095 |
The results of the test show that using eight threads is the optimal solution. It provides you with the best combination of a single test time and overall performance.
You should also pay attention to CPU and memory usage by the apps. I made the following screenshot during the test:
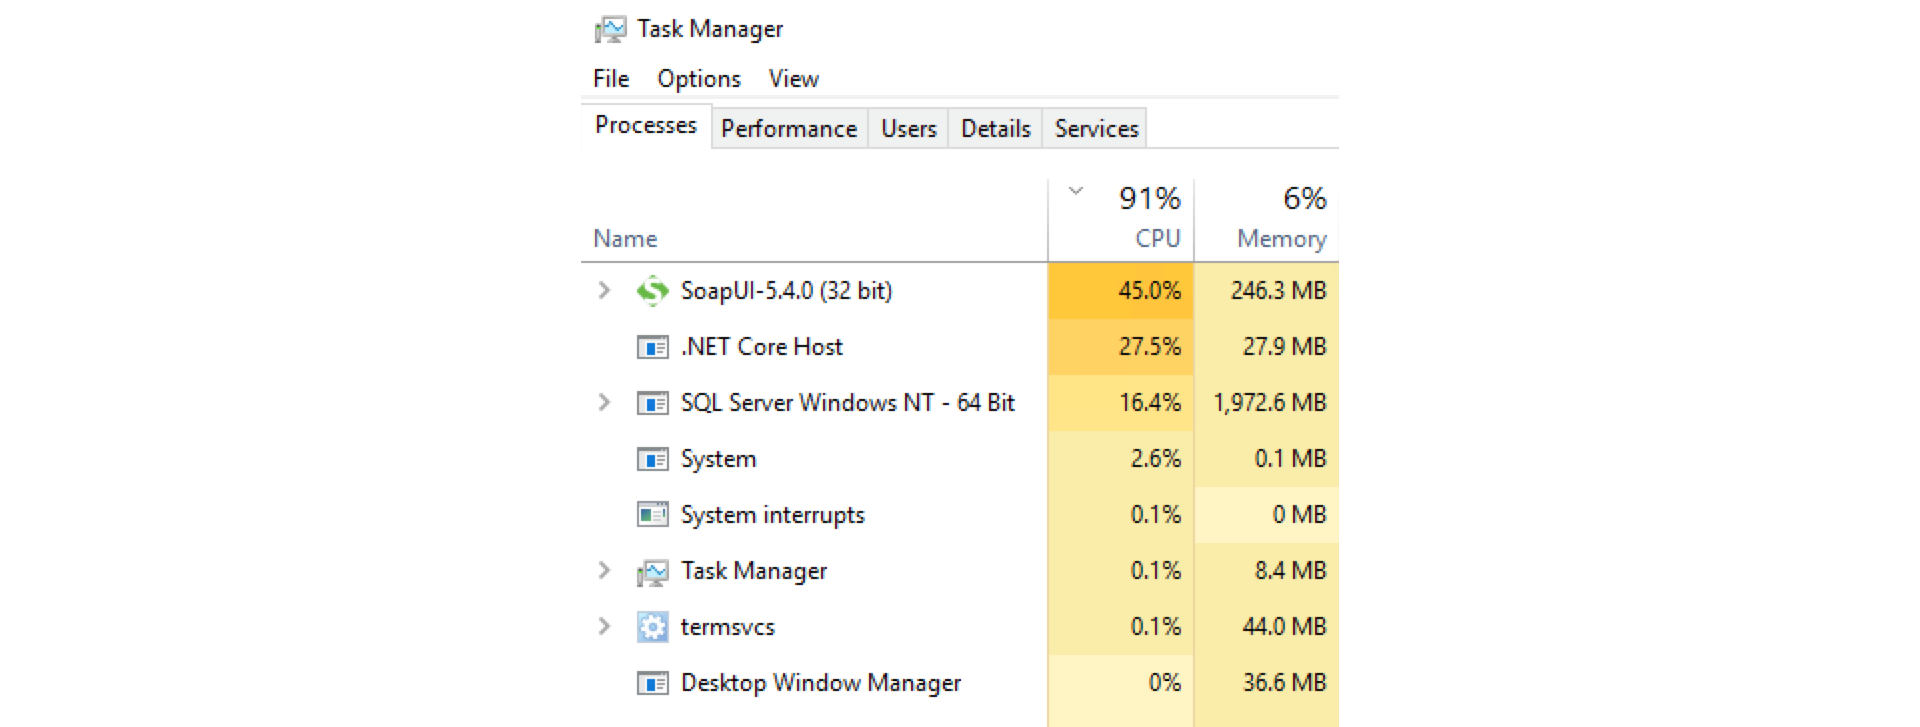
.NET Core Host is a Workflow Server’s process launched in the console. You can see that Workflow Server uses 27.5% CPU and 27.9 RAM. The SoapUI tool which generates loads is deployed to the same server in our test and uses 45% CPU. If we deployed SoapUI to another server, then Workflow Engine’s performance would be higher.
We used DigitalOcean’s One-Click Docker Droplet of the following configuration for this test:
In this test, Workflow Server and the database are deployed to one server, and the utility is deployed to another server. Ping between the servers is 5ms-the servers are located in different data centers in the same region. 150 000 processes were created in the database before running the control test.
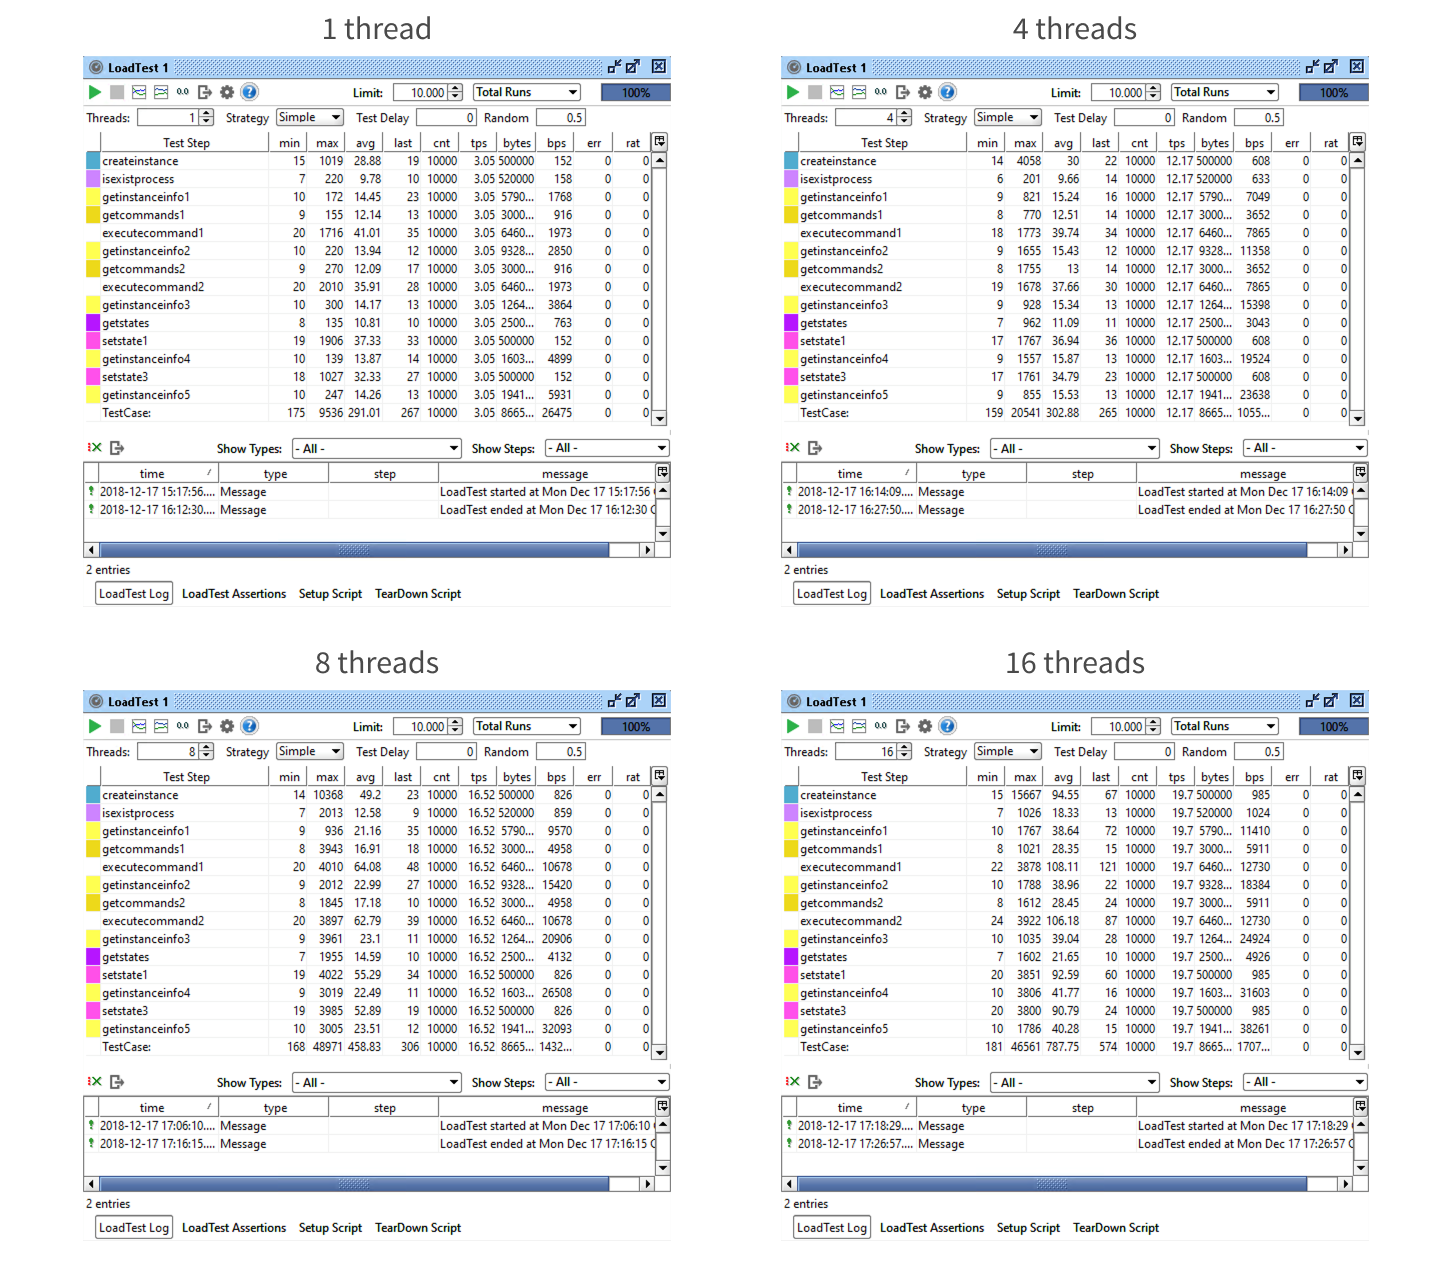
| Test | Total Time | Avg test time (ms) | Tests per second | Operations per second |
|---|---|---|---|---|
| Thread 1 | 54:34 | 291.01 | 3.05 | 42.7 |
| Thread 4 | 13:41 | 302.88 | 12.17 | 170.38 |
| Thread 8 | 10:05 | 458.83 | 16.52 | 231.28 |
| Thread 16 | 8:28 | 787.75 | 19.7 | 275.80 |
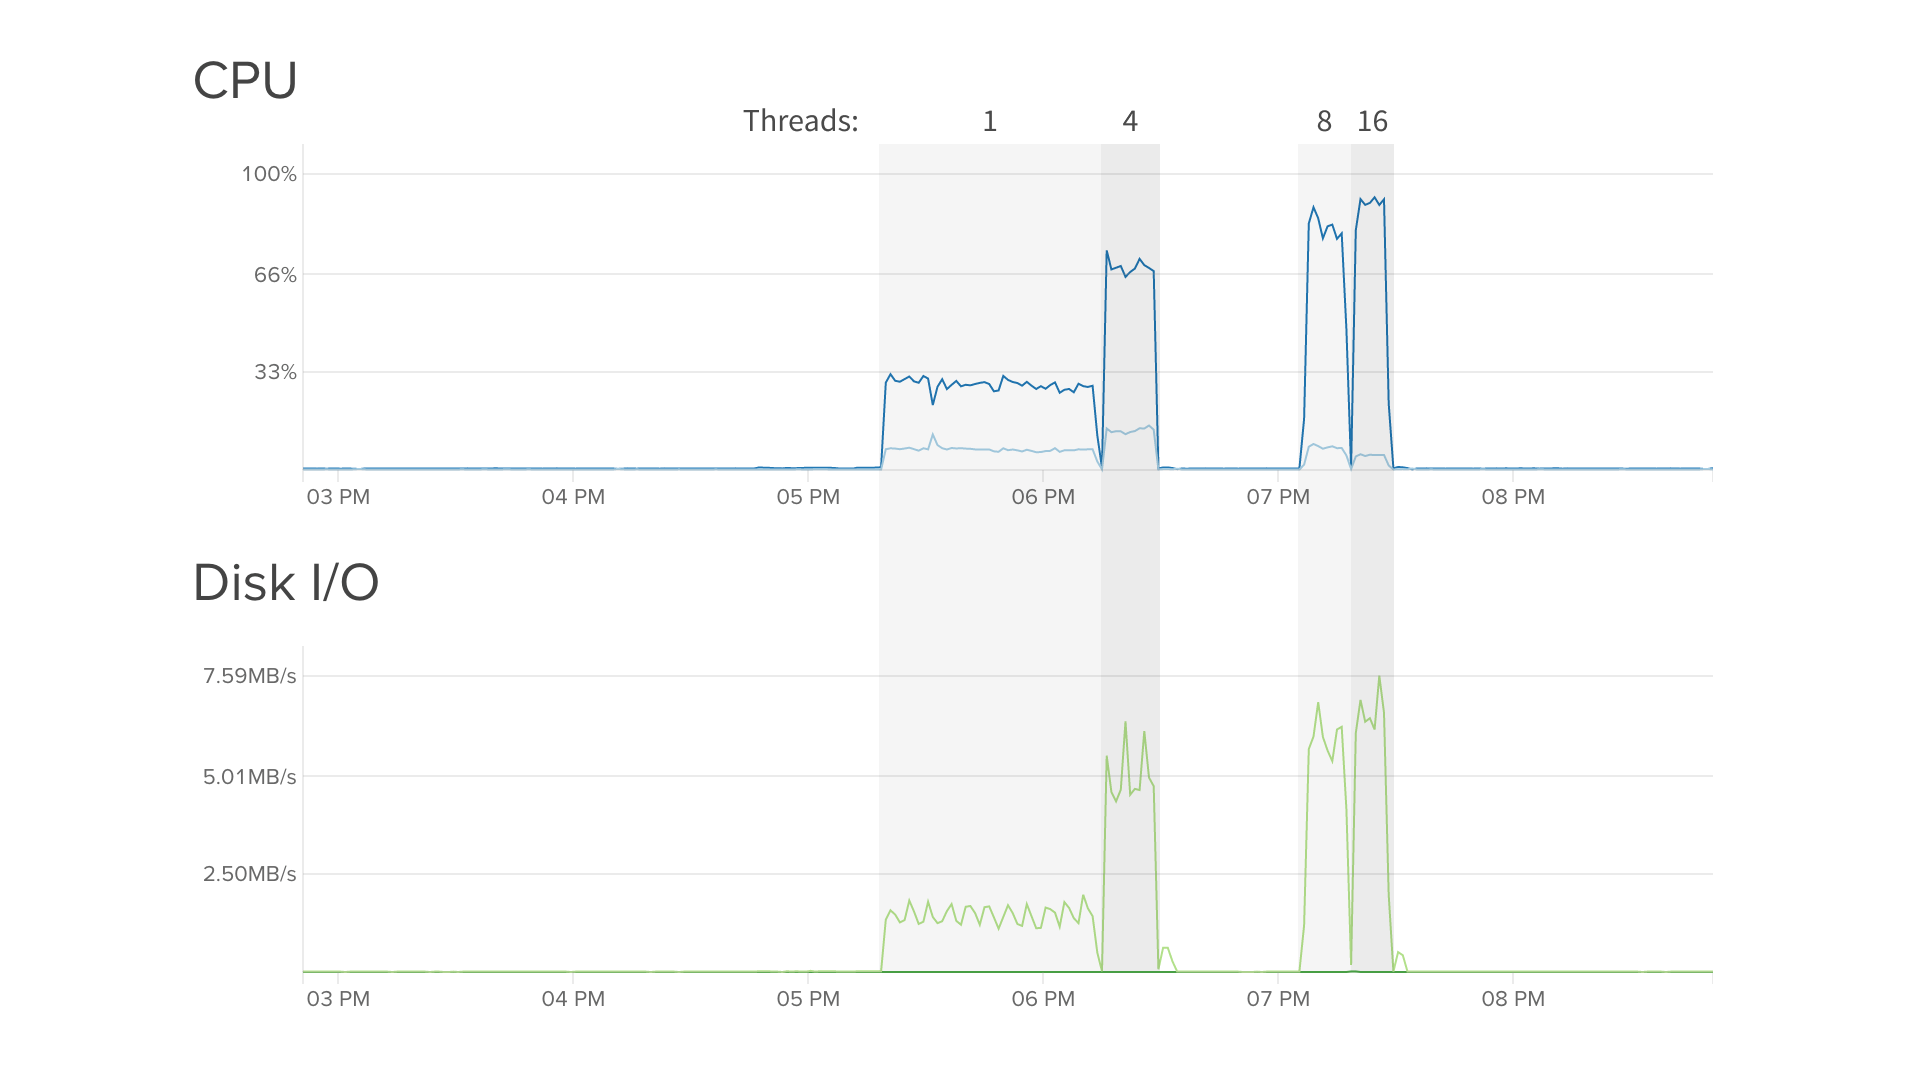
The results of the test show that using eight threads is the optimal solution. It provides you with the best combination of a single test time and overall performance. Let’s have a look at resource load in the Digital Ocean’s admin panel.
Workflow Engine demonstrates perfect performance both on weak machines and powerful servers. A well-thought-through architecture ensures stable processing times even with default database settings and hundred thousands to millions of processes, including active/unfinished ones.
You can process up to 1000 basic operations per second with an average time of processing one request of 5 to 30 milliseconds on an average server. This is enough for any solution from corporate systems to IoT platforms.